
Increasing Transparency With Technical Stories
Agile purists often believe that there are exactly two types of requirements in an agile organization – epics and user stories. It is easy to motivate that at least bug tickets should also be available. In this article I explain why it makes sense to look at technical stories in addition to user stories.
Dependencies and Transparency in User Stories
Let’s first look at what a user story is. In agile product development, a user story describes a customer’s requirements for the product. The focus here is on three essential things. These are the role in which the customer is as a user, the function to be implemented and the reason for the implementation request. The template for a user story is as follows:
As a role I want the feature, because of reason.
It is natural that these features often have interdependencies. So let’s look at the different types of dependencies between two user stories.
Initially, two user stories cannot have any dependencies. In this case, they can be discussed, evaluated and implemented independently of one another. In our example, these should be two stories, each with a complexity of five and eight story points.

Of course, these user stories could also have a simple dependency on each other. In this case it is necessary to implement the user stories in a certain order. The team must take the dependency into account when planning. In our example, the story with five points must be implemented before the story with eight points.

It is getting interesting now. The functionalities described in two user stories may overlap. In this case, the transparency of the backlog is at risk. While the two independent user stories have a total complexity of 13 points, it is not possible to make a definite statement about the complexity in the case of overlapping user stories. This is not a good thing and must be resolved through further refinement.

The part that is contained in both user stories is formulated as a separate requirement and the dependencies are made visible accordingly. In our example, there is a total complexity of 10 points for the decomposed and newly evaluated user stories.

In practice, however, this case arises much less frequently for real user stories than for technical requirements. It happens significantly more often when infrastructure has to be created in deeper layers of the architecture, for example in the database layer. This new infrastructure then serves as the basis for the implementation of the actual user stories.
Introducing Technical Stories
Now let’s take a look at how to deal with such technical requirements. They cannot be formulated as a user story. For this reason, these requirements should be formulated as technical stories. These technical stories then depict the requirements for the technology of a product, which the customer is normally not interested in. As an additional benefit, technical debts can also be recorded in the form of technical stories and thus made transparent.

The outer form of a user story can be used to formulate a technical story. The tasks are then formulated from the perspective of the corresponding role of the developer. This not only makes it easier to refine the user stories accordingly, but also increases transparency.
As a developer role I want refactoring / database connection / etc, because of reason.
Increasing Transparency Through Technical Stories
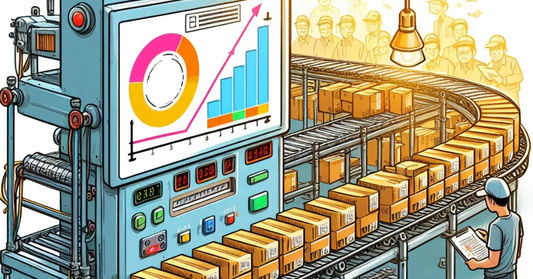
A decisive advantage of using technical stories is the increased transparency in the development. Let’s start with a development team that only uses classic user stories and maps all tasks to these types of requirements.

The diagram shows the team’s velocity over a period of six sprints after the start of a new product development. The velocity is stable and at first glance the team appears to be very productive. Based on this diagram, however, no statement can be made as to whether the team actually delivers functionality and added value to the customer. Since all tasks were recorded as user stories, it is not possible to say how much delivered functionality is in the total of the tasks completed.

If we differentiate the stories into features that can be experienced by customers and technical requirements, the result is a clearer picture. Then it shows that the team had to create a lot of technical basics in the first two sprints. From sprint three, however, the proportion of user stories delivered continued to rise. In this way, the type of tasks the team is actually working on can be displayed very transparently. This makes it much easier to inspect the condition of the product and to make changes to the development in future planning rounds.
Tracking Technical Debt With Technical Stories
The added value of the increased transparency with regard to technical debts is most impressive. The diagram below shows the velocity of the seventh to ninth sprints. As we can see, this is constant. At first glance, the team delivers new added value for the customer at a consistently high speed.

At second glance, the transparent presentation of the technical stories shows that the proportion of user stories in the implementation is declining again. This can be due to an increase in technical debts in the overall system. If this increase does not occur consciously and planned, the transparent representation of the technical velocity helps with the inspection and adaptation. Without a separation of the technical requirements, this would be much more difficult.
Final Thoughts
In summary, technical stories are a very good way to record requirements that are not directly related to customer benefit. This increases the transparency of the product backlog, since a clear distinction can be made between functional requirements and technical requirements or technical debt. Since technical debt should always be kept small, it is necessary that a qualified statement on the amount of known technical debt can be made. The reduction of this debt can also be actively monitored and planned.